There's a bewildering collection of jargon, but most of the concepts in data engineering are ideas that you're already familiar with.
The building blocks
These are the pieces of which all data engineering projects and systems are built.
Data
Data is really easy to define until you sit down to write a definition of it.
If you break it down finely enough, data is all made out of ones and zeros. But that’s not really helpful. That’s like saying that if you break down a wristwatch down finely enough, it's made out of a bunch of atoms. It's technically true, but the interesting part of a watch is the structure the atoms take when they’re put together.
![]()
Data is one and zeros put together in a way that means something. They might be a name, a phone number, an image of someone’s face, a recording of their voice. These are all different types of data, and what gives them meaning, what makes them worth storing and pushing from one computer to another, is that they represent something.
There are a few basic data types that come up all the time
| data type | examples |
|---|---|
| integers | 1, 2, 3, 0, -1, -2, -3, and so on |
| floating point numbers | anything with a decimal place |
| characters | a, b, c, A, B, C, #, %, &, for example |
| strings | more than one character, strung together in a row |
| boolean | can be just 'true' or 'false' |
These go by different names in different computer languages, but are largely the same. The number of ones and zeros used to represent each type can differ by language, operating system, and processing hardware but it is well defined. This is important, because if you tell a data engineer that you want to store a billion credit card numbers, they will be able to work out how many integers that will require, how many ones and zeros they'll need to cover that, and tie it back to how many dollars it will cost you to store them per year.
These fundamental data types can be used to build more complex ones.
Global position, given by latitude and longitude, is a pair of floating
point numbers (floats), as in (56.431440, -6.341224).
Names are a collection of strings for first, last,
middle, honorific, suffix, etc., as in
Pablo Diego José Francisco de Paula Juan Nepomuceno María de los Remedios Cipriano de la Santísima Trinidad Ruiz y Picasso
Dates and times (often mushed together into a "datetime" type) can actually be represented by integers, floats, or strings, depending on what you are using them for.
Pipeline
Data engineering is mainly about moving data from one place to another. In a callback to the tired metaphor that data is the new oil, a data pipeline shuttles data through the system the same way an oil pipeline moves oil from the well to the refinery.
![]()
Data systems are almost always drawn as blocks connected by arrows (directed graphs). The blocks are data sources, processing steps, and various intermediate way stations. Blocks show places where the data is at rest, if only for a moment. The arrows represent the movement of data. A pipeline can mean just one of these arrows, or a whole sequence of them. Pipelines pop up under a couple of names. They're also called workflows, and a single pass from end to end is called a job.
Your home is full of pipelines. The closet-to-hamper clothing pipeline. The bookstore-to-bookshelf book pipeline. The grocery store-to-pantry-to-oven-to-fridge-to-plate leftover pipeline. All of these can be conveniently illustrated with boxes and arrows, and where there's an arrow there's a pipeline.
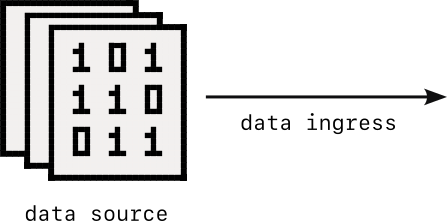
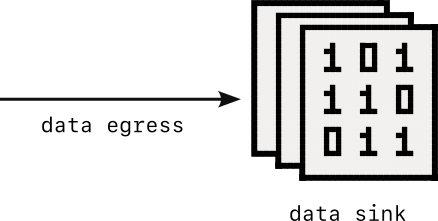
Source and sink
A data source is something that supplies data. It might be an input stream, a feed from a remote sensor, a spreadsheet file loaded from a hard drive.
The complement of a source is a sink, a place where data is handed off, such as a file written to a hard drive or a feed provided to clients. In a data system, sources are the inputs and sinks are the outputs.
In your office data system, your email inbox is a data source. It's an inlet of requests and information that kicks off other actions and emails downstream. Your "to be read" folder is a sink. Nothing that goes there is ever going to see the light of day again.
Ingress, egress
Some of the data movement pipeline steps have special names. Reading data in from a source is an ingestion step. It is also called data ingress, importing, and uploading.
The act of moving data to a data sink gets special labels too. It is called data egress, export, or exfiltration if you're in security.
Extraction
Moving data through pipelines very frequently involves a sequence of extraction/transformation/loading steps. Insiders casually talk about this as ETL, which has expanded to mean generally "doing stuff with data". (Also, more colloquially, "munging".)
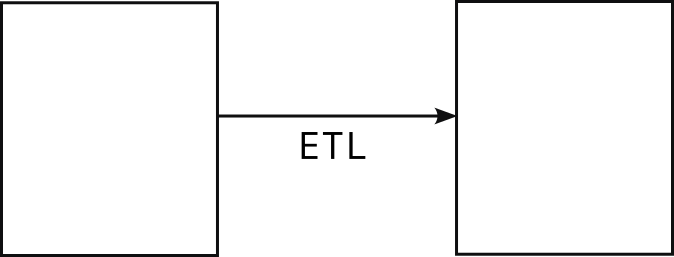
The extraction step describes pulling the data out of wherever it is carefully squirreled away. It covers a lot of techniques, including querying databases, decompression, combing through text files, parsing json, and scraping public websites. It can even cover submitting physical pen-and-paper requests for retrieval from archival storage.
If you've done your own income taxes in the US, then you are intimately familiar with data extraction. Printing W2s, downloading tax documents from your bank, gathering receipts, and rifling through your filing cabinet for last year's return are all part of the data extraction process. It's not glamorous, but there's no getting around it. It's gotta happen.
Transformation
Transformation is a similarly broad umbrella term encompassing just about anything you'd ever want to do with data. Add to it, remove from it, smoosh it together, tweak it, bake it in a pie. If someone points you to a gray box in a diagram labeled "transformation", it's perfectly reasonable (and probably a good idea) to ask what types of transformations are taking place.
Some typical transformation steps:
- deduplication, removing all the extra copies of information, like getting rid of the redundant 1099-INT statements that your bank sent you.
- normalization, making the same piece of information consistent, like making sure your name the same on all the tax forms, rather than having your middle initial on some forms, full middle name on a few, and no middle name at all on others.
- validation, making sure the information provided is correct and relevant, like making sure the receipt you're adding to your charitable deductions is actually a donation, and not from a dinner on the town.
- aggregation, combining a collection of related information, like adding up several W-2s to get your total income.
- encoding, translating information to a pre-defined set of codes, like making sure employer contributions to a health savings account are listed as a W in box 12 of the W-2.
Loading
When the data is all transformed, it needs to be shuffled off to the next stop on its pipeline journey. This is similar to the extraction step. It's soooo boring, but there are so many ways for it to go wrong that it deserves careful attention. Every data desitnation will have its own quirky requirements for what format the data needs to be in, how fast it can be received, and in what size chunks. Neglect the loading step at your peril.
In the income tax process, this is the filing step. There are lot of hoops to jump through before you're done, like logins, verifications, and signatures, not to mention confirmations and follow up emails telling you when it's completed each step. No single piece of the process is complex, but taken together it does require careful tending to make sure it doesn't hit a snag.
Databases
The blocks in a data system, the way stations where the data temporarily rests on its journey from a source to a sink, come in different flavors. An extremely common one is the database.
![]()
In case you're wondering why database icons are always drum-shaped, it's because a very long time ago bits were carved into stone tablets with magnetic chisels. These tablets were circular in shape and stacked on top of each other, resulting in something shaped like a can, or a drum.

But it's actually more useful to think of a database as a giant spreadsheet table. Each column is a different type of information and each row is a different example of it.
Your email inbox is probably an example of this.
Each row is a separate email, each column is some piece of information about that email. In most important ways, a database is just this, except there might be billions of rows instead of dozens.
Schema
One important way in which a database is different from a spreadsheet is that is has a rigid definition for which data types go in which columns. This is a fundamental characteristic of databases, and goes by the name of schema.
The email inbox table above has a schema that looks like this.
| column | data type |
|---|---|
| sender | string |
| subject | string |
| date | datetime |
A table's schema is defined when it is created and acts as a contract. Any attempts to access a column that's not there or to read or write the wrong data type will likely generate an error.
Metadata
A fancy word for "data about the data", the metadata is a collection of information about a table. It can include a lot of different things like
- the schema
- total number of rows
- total size on disk
- number of unique values (cardinality) of each column
- when the table was last updated
- who created the table
- who has permission to read from and write to the table
- other tables whose data was drawn from to create this one
Metadata can be useful when tending your organization's collection of data assets or when combing through tables to find the one you want.
Data store
Tables become very awkward when storing larger items, like https://raw.githubusercontent.com/brohrer/blog_images/refs/heads/main, audio, or video files. These are often much larger than the other data types in a table and can throw off the database's strategies for efficient storage and quick access. In these cases, the files can be stored in something resembling a library bookshelf. An index points to the file's location where it can be read and updated.

The simplest version of this is storing your travel photos on your hard drive in directories named "Disneyland 2019", "Scotland 2022", and "Iceland 2024". A data store is a tool that extends this to millions of trips and billions of photos without you having to worry about filling up your hard drive or remembering what you named that one directory you are looking for.
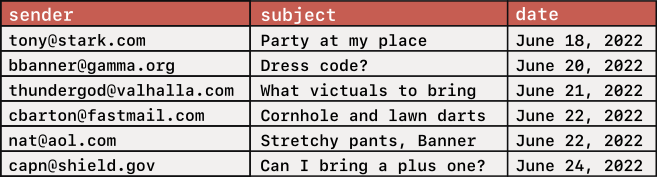
Key-value store
Sometimes you care about speed more than anything else. Key-value stores are databases made to be fast.
Instead of having dozens or hundreds of columns, a key value store only has 2: a key and a value (maybe you saw that coming). The key is the handy lookup address, designed to be quick to locate, and the value is the piece of information you want to retrieve. It's like a well-designed pegboard in a garage shop, with every tool clearly visible, intuitively located, and easy to reach. Compared to rummaging around in the drawer for the 9/16" box-end wrench, grabbing it off the wall is instantaneous.

The really cool part is that, because they have only two columns, key-value databases are typically small enough to be kept in RAM, making them thousands of times faster than databases that have to read from a disk.
There are some popular key-value stores that you may run across, depending on the tools that your team uses: DynamoDB (created at Amazon), Memcached (created for a Russian social media website), and Redis (created for an Italian startup).
Architecture
With these building blocks in place, we can create various assemblies of them called data architectures.
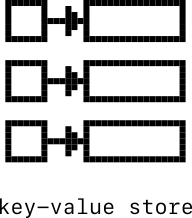
Data Warehouse
![]()
If a database table is like an overgrown spreadsheet, then a data warehouse is like a hard drive full of thousands of spreadsheets. It’s a collection of practically all the data in an organization, ingested, up-to-date, and ready to be put to work.
The data warehouse is the beating heart of a company's data ecosystem. If a single database can be huge, than an entire data warehouse can be absolutely enormous. The choice of how to implement and administer a data warehouse has direct impact on its cost and performance in a way that can be felt across the company. Because of the scale, small changes can make an important difference.
There are plenty of reputable vendors out there happily offering to solve these problems for a CTO. Some of the most common are Snowflake, Databricks, Google's BigQuery, Amazon's RedShift, and there are dozens of others. They will all tell you why their product is clearly the best for your organization. When deciding between them, there is no shortcut for developing a clear and opinionated view of your organization's needs and evaluating the candidates based on those needs.
Data catalog
![]()
Once you have more than three database tables in your data warehouse it starts getting hard to remember everything that in there and how to find it. A data catalog helps keep track of inventory, giving a searchable list of database and table names, as well as all the column names and their data types from the schemas. A data catalog can also include information on who can access the data, which tables it was derived from, when it was last updated.
A starter data catalog might just be a spreadsheet, compiled by hand. More sophisticated catalogs are integrated with the data warehouse and automatically update as the tables are created and changed. Whether simple or sophisticated, a really well curated data catalog will have human-friendly descriptions of what the data in each column means.
Data layers
The data warehouse may be the central hub of a data architecture, but there are other important levels, both upstream and down. These are sometimes called data layers, although they have other names too.
There is a proliferation of names, labels, and buzzwords for data concepts. These are useful to know so that if you come across them you can nod knowingly. The data warehouse, for instance, is variously called the warehouse layer, the storage layer, the core layer, and the silver layer (please don't ask).
Some architectures will slice these layers more finely, and end up with five or six. Others may even collapse them down. The overriding conceptual link between them all is that data flows from left to right, from chaotic to organized, from raw to refined.
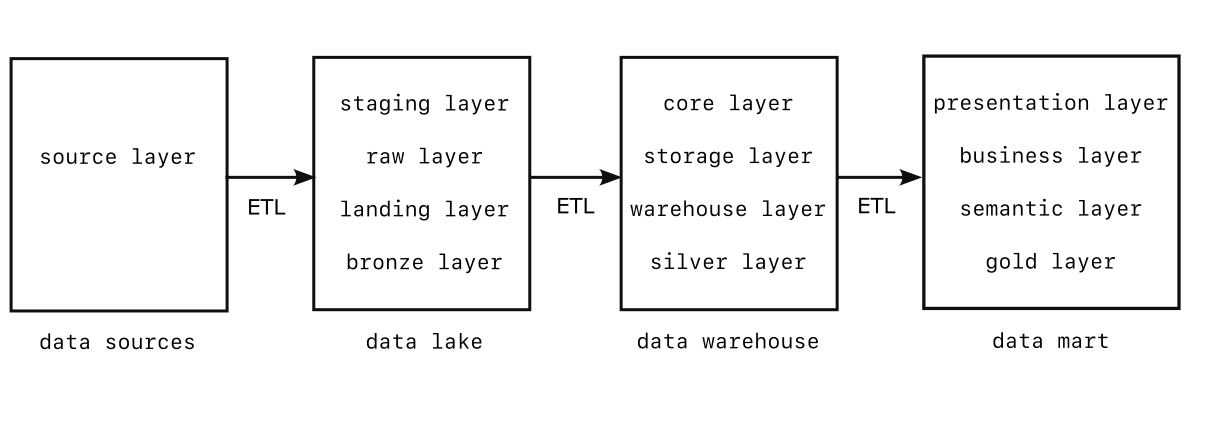
Source layer
Far upstream of the data warehouse are all of the raw data sources, some internal and some external. This data source layer can be particularly messy because it contain so many different data formats, and so many different types of data coming through so many different connections. External sources require detailed knowledge of how each vendor will package their data flow. Internal sources come from measurement and reporting systems that themselves have to be maintained. The source layer is the wild west, a complete jungle. It's best to be prepared for anything there.
Staging layer (Data Lake)
The staging layer is where everything gets dumped. It's the loading dock. It is raw materials, sitting in giant bins, waiting to be sorted and properly ingested into the factory.
![]()
As opposed to a data warehouse, or core layer, which has all the data carefully arranged in well-designed tables, a staging layer is far less organized. It can have any combination of tables, accumulated data streams, structured and unstructured file collections. It doesn't have to be any more complicated than a single large data store. This lack of cohesive organization has earned it the name of data lake (and sometimes data swamp, when frustration levels run high).
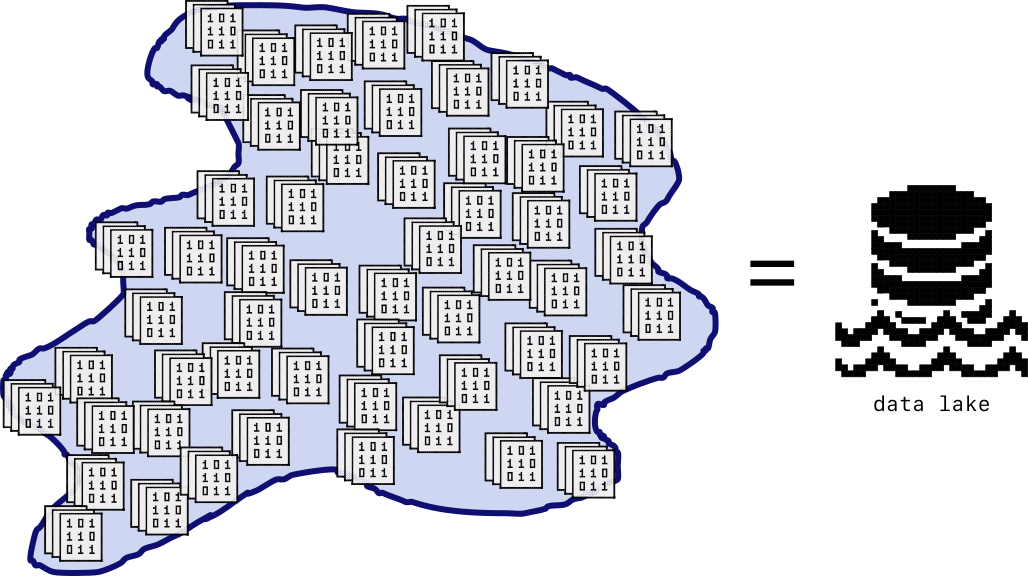
Despite its lack of polish, the staging layer is highly useful. There are some questions that can only be answered by a deep dive into the raw data. Intrepid analysts, dogged machine learning engineers, and deep debuggers go spelunking in the staging layer quite often.
Because people so much spend time in the data lake, some vendors have gone out of their way to make it easier to navigate, enforcing more structure on what data is there and how it's organized, and adding a data catalog. Data lakes with structure start to resemble a data warehouse, so a clever marketing team came up with the name data lakehouse to describe them.
Data lakes are available in the regular suspects' cloud platforms
- AWS has a bare bones option, s3, and a data lakehouse called Lake Formation.
- Google also has the bare bones Cloud Storage, and the fuller-featured lakehouse called BigLake.
- Azure offers Data Lake Storage.
There are also popular ones from
- Databricks offers A data lake-centric plaform ideal for analytics and machine learning. They also offer a data lakehouse called Delta Lake.
- Snowflake started out as a data warehouse and grew data lake capability, rather than calling itself a lakehouse, it identifies as a "data cloud".
as well as data lake offerings from Dremio, Cloudera, Teradata, and a dozen others.
Presentation layer (Data Mart)
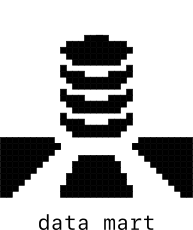
Proceeding from left to right across the layers, data becomes more refined, more crafted to serve a particular purpose on the other end. A data mart is a more-cleaned-up and organized version of the data warehouse. Useful slices of the data have been collected, carefully filtered and collated, and served up in a clean table for inclusion in prediction models and pie charts. If the data warehouse has a database full of every purchase made at your business, the data mart might have a table of total purchases by month, broken down by category (baguettes, rye, sourdough, seeded whole wheat, etc.).
![]()
The presentation layer is data that is ready to be lifted and included in a PowerPoint slide. Most importantly, its full of data that has been shaped in order to do a particular job. There are a zillion different ways that the data warehouse inventory could be filtered, aggregated, shaped, and renamed. The data mart can only host a few of those, and it focuses on data that has been refined for a purpose. The flip side of that is that you have to know what your data is going to be used for before you can populate your data mart.
By the way, with data marts we've passed a notable milestone. We've moved from the realm of infrastructure into the realm of descriptive organizational and marketing terms. There is no distinction between the databases and tables used by a data warehouse and those used by a data mart. It's the same vendors, selling the same code, backed by the same storage devices. The difference between a warehouse and a mart is purely in how refined the data is. Because of this, some architecture diagrams remove the distinction entirely. And some add an extra layer in between them. It's about how the data is organized and used more than where it lives and in what format.
Data product
The metaphor of refining data gets taken further with the concept of a data product. Raw data gets shipped to the data warehouse, where it is refined into a "product" that gets offered in the data mart. The notion of a data product emphasizes that it is intended for someone on the other end to do something useful with it. Raw temperature measurements from thousands of weather stations in the data lake get collated into tables of measurements by location in the data warehouse which get further refined into temperature ranges by day of the year in the data mart, and that data product gets pulled directly into an app making long range temperature predictions for event planners.
As something intended for use, a data product can benefit by product management thinking. Who is going to use it and what are they going to use it for? How often? What is the cost of it being inaccurate? Slightly out of date? The answers to these questions drive the dozens of small decisions necessary to create a fit-for-purpose data product.
Data orchestration
![]()
Moving data through these layers on a regular schedule is the job of a data orchestrator. In addition to running the ETL steps on a timer it takes care of niceties like making sure downstream steps wait for their upstream steps to complete, automatically retrying steps if they fail, and notifying you if they don't end up working after several retries. Every major data platform has their own tooling for orchestration and there are some others besides. Airflow, Dagster, Prefect, Luigi, and Keboola are some that you may run into.
Data mesh
Because the end goal of the data pipeline is data products, built for particular people to answer particular questions, a data mesh approach takes this to the extreme and makes every team responsible for their own pipelines, from source to mart. On the upside, this gives end users much more control over their data products. You want dates to be in ISO-8601 format? Done. You want your daily revenue averages to exclude holidays? Done. Your team can make your presentation layer data whatever you want it to be.
On the downside, this increases the chance that there will be 5 different ways of calculating Monthly Average Users across the company, and all of them will believe that they are the right one. More problematic, you may also end up with 5 different ways of handling user privacy. In practice, a data mesh approach requires a fair amount of coordination and centralized governance to be successful.
Data virtualization
You may have noticed that in the lake-warehouse-mart multilayer architecture the same piece of data might be copied several times. That extra storage can feel very inefficient. Data virtualization is an approach where data is only pulled through the pipeline when it's needed at the far end. (A virtualized data table is also called a data view.) It only exists in the mart in a virtual form. Rather than going to the store and buying a bike off the rack, it's like browsing a catalog and pointing to a picture of a bike. The bike frame may not even be welded when you place the order, but after you do it is assembled and shipped to you.
This comes with the trade-offs you might expect, low inventory storage costs but longer waits while the data gets pulled together and processed. In data pipelines virtualization has the added benefit that it can serve up the most recent information. Rather than having all the data products in the data mart updated nightly, they can be built on up-to-the-minute updates.
Data Fabric
For the life of me, I haven't been able to figure out what this means. All the descriptions I've read look like they were written by a buzzword generator. It's some mishmash of data mesh, data virtualization, structured data catalogs, AI recommendations, and pixie dust.
Data replication
Getting back to the nuts-and-bolts of architecture, data replication is exactly what it sounds like—making a copy of your data. It's useful for making backups in the even there is a disastrous event or an unlucky keystroke. It's also useful when you want a customer or an employee to have fast access to data that is far away. Having a nearby copy can speed up that acces time considerably.
Database partitions
Sometimes databases get so big that they are awkward to work with. When this happens, it's common practice to break the database into smaller chunks, also called partitioning.
A horizontal partition is when the database is divided such that rows are kept whole. This is useful when there is an easy way to tell which row belongs in which database, for instance by first digit of a random ID or by country of origin. You may also hear horizontal partitioning referred to as sharding.

A vertical partition is when the database is divided such that the columns are kept whole. This is especially helpful in wide databases, those with many columns, and doubly so when most of those columns are rarely accessed.

Partitioning can make it much faster to get the information you need from your databases, but it comes at the cost of a more complex system, which requires more hardware, more tweaking, and more maintenance. The question of whether and how to partition will depend heavily on the type of data you are storing and what you are using it for. It quickly gets into the gritty details of access patterns and query structure. It's definitely not something you want to walk into blindly.
Distributed database
When a database has been partitioned, its pieces can be stored on different disks and even on different continents. When this is the case, it is considered a distributed database. Distributed databases frequently use data replication as well, to enhance their robustness and speed.
Consistency
There are a few important ways to measure how well a database does its job. Consistency is at the top of this list. If two different users are querying your database, consistency means that they will see the same answer. Consistency comes in two flavors: strong and eventual. Strong consistency is the obvious kind. Once a database value changes for one user, it changes for all users. This is hard to do reliably and quickly, especially in distributed databases, so a popular alternative is eventual consistency. In eventual consistency, a change in the database will eventually make its rounds for all users, but it may take a little time.

Sometimes eventual consistency is plenty, When it’s not being used to support critical or time sensitive decisions or when small updates won’t change those decisions in a big way, eventual consistency is all you need. A database of hourly weather predictions, or of university rankings isn't likely to suffer by updating at slightly different times for different people. But strong consistency is what prevents a calendar app from letting people double book your time or an online marketplace from selling more of your handmade bookshelves than you have in stock.
Throughput
Throughput is processing volume. It’s typically measured in queries per second (QPS) or transactions per second (TPS). It’s usually possible to trade strong consistency for throughput. Maintaining strong consistency typically requires that the whole database be locked down whenever a transaction is happening. But if you can get away with eventual consistency, you can exploit concurrency – conducting many transactions simultaneously.
Latency
Latency is complementary to throughput, another aspect of database speed. It’s a measure of how long it takes to process a query or transaction from start to finish. Lots of factors can affect latency, including consistency, sharding and replication, the type of database being used, the way the query is phrased, and even how its columns are arranged. Making your databases snappy involves tweaking all these things and a lot of trial and error. Because latency is different for each transaction it’s common to report the 99th percentile, not the longest latency ever observed but the threshold for getting into the the top 1% of long transactions.
Freshness
Data freshness is a measure of how out-of date your data is. As soon as something is measured, that information starts to age. A reported stock price is only useful when it is very recent. After thirty minutes it could have changed quite a bit. It may not even be the same after a few milliseconds. The older, more stale, data gets, the less useful it is.
With a multi-layer data architecture freshness is a real concern. It's common for data warehouse and data mart tables to get updated nightly, in which case their data can be up to 24 hours old. If you're willing to pay for it, you can get around this by running updates more frequently or using more sophisticated architectures that specialize in rapid updates, but it gets expensive fast and becomes tougher to maintain. When the CEO says they need their dashboard to have up-to-the-minute accuracy, it's worth putting a price tag on that request and making sure that they want it as badly as they think they do.
Star schema
One of the biggest factors in the latency and throughput of a database are how the data is laid out, i.e. the schema. It also determines how much memory, disk space, and CPU cycles are necessary to work with it, which combined drive most of the cost.
A flat schema is what we're all familiar with in spreadsheets. There is set of columns and a set of rows laid out in a grid.
Each row in a flat schema is a separate measurement, a separate observation. In database jargon, each row is a separate fact, and it so it is also called a fact table.
Something that tends to crop up a lot in a flat schema is groups of columns that change together. Picture a payroll database with coulmns for
- check number
- date issued
- check amount
- employee name
- employee email
- employee phone number
- employee home office name
- employee home office address
- employee home office fax number
- issuing bank
- issuing bank address
- issuing bank phone number
All the paychecks for a particular employee will have the same name, email, phone number, home office, and home office contact information. And all the paychecks issued by a particular bank will have the same bank name and contact information as well.
Repeated information is a giant red flag for data engineers. It means that precious disk space and CPU cycles are being wasted. The solution to this is the star schema.
We can re-imagine the payroll database with the columns
| check number | date issued | check amount | employee ID | bank ID |
|---|---|---|---|---|
Then we can create another table of employees with columns
| employee ID | employee name | employee phone number | employee email | home office | home office address | home office fax number |
|---|---|---|---|---|---|---|
And a third table of bank information with columns
| bank ID | bank name | bank address | bank phone number |
|---|---|---|---|
The employee ID and bank ID are the links between these tables. They’re a special type of database column called a key. In the bank and employee tables, they are primary key columns, and they uniquely identify each row. In the payroll table they are foreign key columns, which just means that they are referring to the primary key of another table. To qualify as a primary key, each employee has to have their very own ID number. No sharing. The same goes for the bank ID.
Uniquely identifying someone is hard. Names, birthdays, home addresses, and phone numbers can all belong to more than one person. Even US Social Security numbers in rare instances. The only way to be certain is to create and manage the identification process in your own organization. One popular approach is to use universally unique identifiers (UUIDs), ID numbers that are so large that you are more likely to win the lottery than to accidentally duplicate them.
The star schema means that each new fact in the payroll table doesn’t unnecessarily copy all of the details for the employee and bank every time. It only includes things that are likely to change from row to row.
And even though the employees' and banks' information may change occasionally, if either gets a new phone number, for instance, it’s almost always the most recent values that we care about. The employee and bank tables elaborate on particular aspects or dimensions of the fact table and are called dimension tables.
You may have noticed that we still have some repeating information in the employee table. Every time a particular home office is mentioned, its contact information gets repeated across multiple columns. We can take the star schema and apply it again to pull out a home office ID and create a separate home office table. Multi layer star schemas can go as deep as needed, and these have been given the poetic name of snowflake schema.
Data model
Several assumptions and judgment calls went into creating the payroll tables. Separating out the home office into a separate table only makes sense if lots of employees share that office. If everyone is working from their actual homes, then home office information would make more sense in the employee table. Choosing to include employee name and paycheck amount in the same table means that anyone with access to that table would be able to see everyone else's paychecks; in some companies that is considered sensitive information. And there was a lot of information that we chose not to include in any of the tables, like employee title, start date, bank account number, tax witheld, and so on.
Choosing the columns and structure of fact tables and dimension tables requires making these assumptions explicit. This process is called data modeling.
One important part of data modeling is choosing what data type each field
should be.
This sounds like a small decision, but it can have big implications.
Should money be represented by a floating point number of dollars?
Or by an integer number of cents? Should date and time be a human
readable string? Or an integer number of milliseconds since January 1, 1970.
(I know that one sounds weird, but it’s really a thing.)
Should small/medium/large be represented with the strings
"small", "medium", "large"? Or with the integers 1, 2, 3?
And, one of the biggest database gotchas of all, should the absence of
data be represented by a zero? An empty string? A nan (not-a-number)?
The string "none"? The null type? Or some cursed combination of these?
Another important part of data modeling is categorization. Sometimes it’s useful to represent continuous values as bins. For instance, salaries are also often represented in ranges, rather than with precise numbers. How big should those bins be? And where exactly to place the cutoffs?
Categorization also comes up all the time when trying to organize things into groups. Imagine a database of restaurants. Each restaurant or chain will have a distinct name, but it may be helpful to be able to handle them in groups in order to compare, say, pizza places with Ethiopian restaurants. Deciding on the right set of categories for restaurants doesn't feel like a hard problem, until you sit down at a table with four other people and try to write down a list of cuisines that accurately categorizes all the restaurants in your town.
- How do you group them? By the geographic region they're associated with? Does that mean Chinese, Japanese, and Korean all get lumped together? (And would that group contain Panda Express?) What about Greek, Italian, and Lebanese? By quality of the experience? Average price of an entrée? Whether they have white linen tablecloths? Small plates versus his family style? By what meals they serve? Breakfast place versus lunch spot?
- How specific should the categories be? Should Sichuan be distinct from Hunan, Cantonesem, and Shandong? Should Guatemalan be distinct from Colombian, Salvadoran, and Venezuelan?
- What does it take to qualify as a restaurant? Is an ice cream parlor a restaurant? What about A coffee shop? A coffee shop that serves bagels?
- Can a restaurant be more than one type of cuisine? Is cuisine an attribute of an eating establishment or the items on its menu? If a restaurant offers pizza does that automatically make it a pizza place? How would you categorise a Vegas buffet?
And the toughest question of all: What exactly constitutes a sandwich

What makes categorization difficult is that there is not just one right answer. Or more accurately, every answer is kind of wrong. The most important thing is to find an answer that is useful, and to do that you need to know what it will be used for and keep that in the forefront. The other hard thing about categories is that if you get them very wrong, it will severely limit your ability to answer some questions and will blind you to some trends entirely. It’s worth the effort to create a good set of categories when you’re doing your data modeling. A collection of categories and sub-categories is also called a taxonomy, and luckily there are people who specialize in creating useful taxonomies so you don’t have to go it alone.
When data modeling is done well it looks effortless. The data is broken up very logically into tables and laid out into meaningful columns without a lot of superfluous or hard to interpret columns. When done well it’s easy for it to be underappreciated and to miss how much effort goes into getting it to that state.
You can tell when your data modeling needs improvement by how complex queries have to be to get at frequently accessed information. If my business is selling artisanal ice cream, then I should be able to figure out how many pints of which flavor I sold last month by just looking at a couple of columns. If it requires me to join three tables and parse a JSON expression, then I know my data modeling needs work.
OLTP and OLAP
The wonky details of database performance, data modeling, and whether a database is partitioned by rows or columns sound like something only a hardcore data nerd would be interested in, but it turns out they have big implications for the non-nerds as well. They tie in to the two general categories of what databases are used for: online transaction processing (OLTP ) and analytics processing (OLAP ).
Transaction processing focuses on reading and writing individual events (rows!) very quickly, reliably, and predictably. It's what you're most worried about if you're selling tickets to a Taylor Swift concert and you want to make sure two fans don't end up buying the same seat in the first 17 seconds after sales begin.
Analytics processing focuses on aggregating information to answer questions, pulling out a particular aspect (columns!) and binning it, averaging it, or even just counting it. For analytics processing, it's usually less important to include the data generated in the last five minutes than it is to be able to run the anlysis quickly, before the data scientist running it gets distracted by a new machine learning model.
The focus on row-centric vs column-centric operations requires some significant differences in how databases are built. Any given database can be good at one or the other, but not excellent at both. The same database optimizations that allow for quickly adding millions of ticket purchases do help in quickly summing up those purchase totals by zipcode.
Typically, OLTPs are located in the data sources layer. They are usually narrowly focused on collecting a given type of information and are very good at it. Once that gets ingested into a data lake, it typically crosses over into OLAP databases, although there are more exceptions than rules here. The data lake can be pandemonium. By the time data reaches the data warehouse and data mart, it is almost invariably in an OLAP database. These layers, even the data lake, exist mostly to answer questions, leaning into the A of OLAP.
It's not always easy to tell which database product is OLAP and which is OLTP. As with many categorical boundaries, once we start looking closely at OLAP/OLTP categories, the dividing line gets pretty fuzzy. The two labels are descriptive rather than technical. Some databases are clearly OLAP (AWS Redshift, Azure SQL Server Analysis Services) or OLTP (AWS RDS, Azure SQL Database), but GCP BigQuery bills itself as a hybrid transactional and analytic processing (HTAP) database that can be configured to work reasonably well as either one.
Zooming in on the next level of detail, there are several aspects of performance that usually distinguish OLTP from OLAP from each other—read/write latency, input/output bandwidth, throughput, strong vs. eventual consistency, data freshness—but some databases have characteristics of both. Unless you are a database specialist, you don't need to worry about configuring and fine-tuning your database to optimize these. But if you take care to learn what types of data your business will be working with, what they will be used for, and how often, you can provide that to your data engineering team, they'll be able to craft you a data architecture to handle it, using OLTP and OLAP databases purpose built for your company's needs.
Data Environment
In machine learning heavy companies, the data from the data warehouse is also used to give the customers a better experience. It might be used to make drive time predictions or recommend a pair of shoes. When the machine learning features are important to the health of the business it is important to both keep improving them and to avoid accidentally breaking them in the process.
It's common to provide a sandbox for software developers to work the kinks out of new ideas, called a development environment or dev environment for short. Having a dev evironment for data serves the same purpose; it gives a sampling of data that can be easily recreated if it gets corrupted and has no privacy demands. It's a place where screwing up has a very low cost.
Then, after a software change has matured and is getting ready to go out into the world, it gets a dress rehearsal in a staging environment. Staging is a step closer to repreresenting the real worl than dev. If your data collection is manageable enough, you can just copy it in its entirety to create a data staging environment, but once your data gets large and unweildy enough this will not be economical.
When the new code has gestated in staging with the staging data for long enough, it gets released into the real world, a production environment or just prod. Production data is the real deal, with all the consequences for messing it up and all the glory for transforming it into a delightful customer experience.
Deciding exactly what should constitute the dev and staging environment in your organization is tied closely to your software development process and the nature of your data, especially to cost of losing part of it or of violating privacy protections on it.
System level
If you end up having to lead the data efforts of a whole company, you'll have another set of concerns that goes well beyond the data itself. They are each worthy of dedicated posts, but I'll mention them briefly here.
- Data security — making sure that only the people who access data are those that are allowed. This is tightly tied up with the topics of privacy and access controls.
- Data provenance — keeping track of where data came from upstream and how it has been modified. This is especially relevant if you hold customer data and need to comply with GDPR.
- Disaster recovery — having a Plan B in case a disk fails, you have a ransomware attack, or a natural disaster takes out a data center. It's not just about having backups, but about how quickly your org can detect and recover from catastrophe.
- Data governance — creating policies and practices to enable, encourage, and enforce all of the above. Also includes the managing of data retention and the data lifecycle.
One last thing
You may have noticed a theme during the tour, namely that there is not one right way to do data engineering. There are always trade-offs, and the best decision for your team will depend wholly on the data you have and what you want to do with it. There is no one size solution. You don't personally have to know all of the intricate details of your data, but you should definitely find the person on your team who does, and really listen to them.
I work with tech leaders in small and medium-sized companies to navigate all aspects of data, analytics, and machine learning.
If you'd like a note when the next post comes out, email me at posts@brandonrohrer.com